Large-scale Go GC Tuning in Production
This article documents a production GC tuning project that achieved CPU savings across hundreds of services.
Project Scale:
- 67 services selected from 6700+ candidates
- 49K instances affected (42% coverage out of 116K total)
- Total CPU quota: 682K cores
- Total memory: 1.11 PB
- Statistical window: 1 hour after campaign start (12.12 sales event)
1. Background and Goal
Goal: Reduce CPU usage for services with large CPU quotas.
Hypothesis: If we increase memory utilization by increasing GOGC, we can: 1. Trigger GC less frequently 2. Reduce GC CPU overhead 3. Improve application throughput
2. Memory and CPU
Core Mechanism
GC tuning improves instance memory utilization, triggers fewer GC cycles, and reduces application CPU usage by lowering GC CPU overhead.
Baseline vs Feature
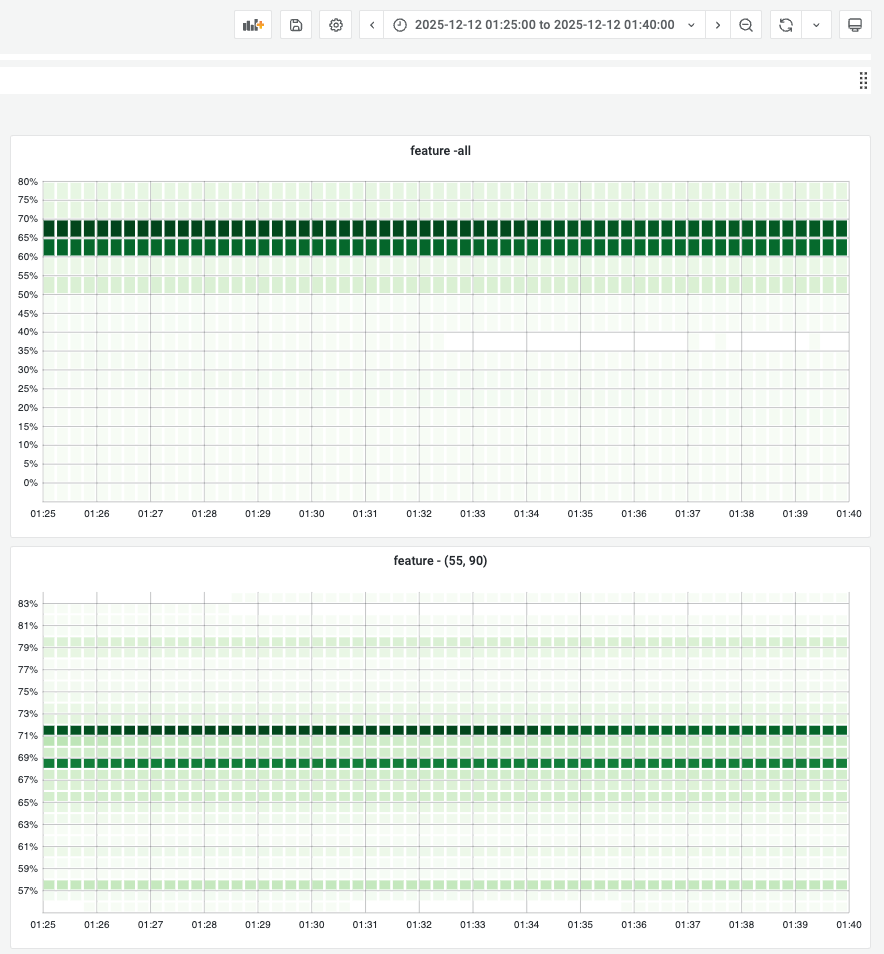
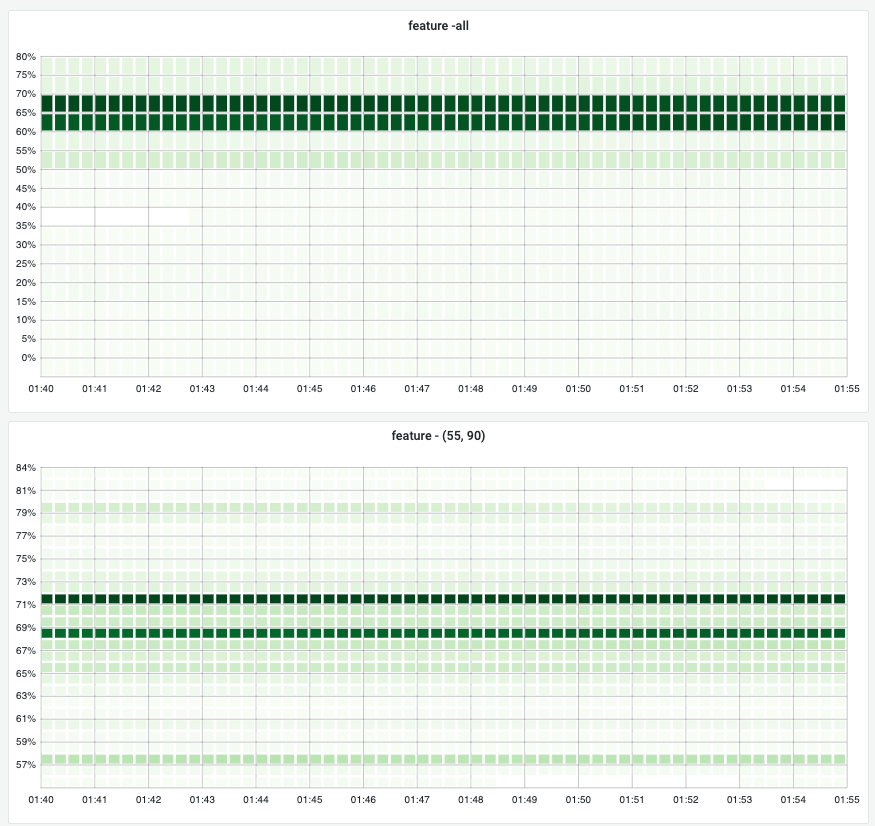
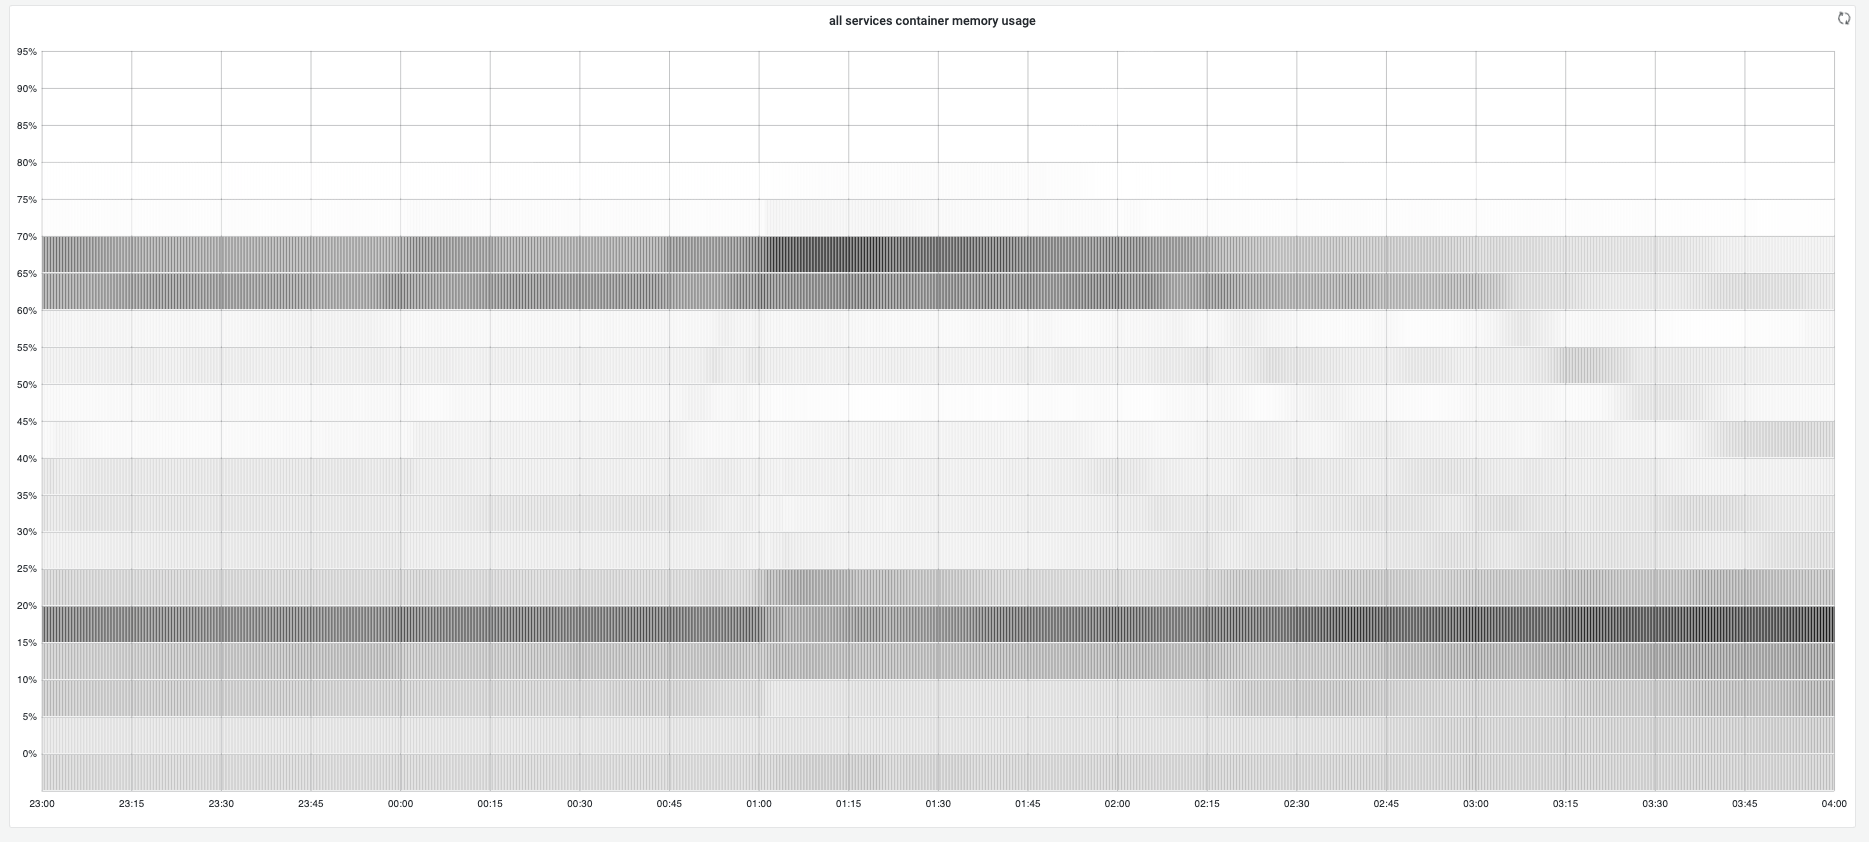
The heatmap below offers a comprehensive overview of memory and cpu usage for all candidate services:
The top 2 boards show gc tuner enabled services memory distributions, by setting preferred target heap, most instances' memory usages stay at 70%. If we narrow down the heatmap(top right board), most of instances stay at 71% and 69%.
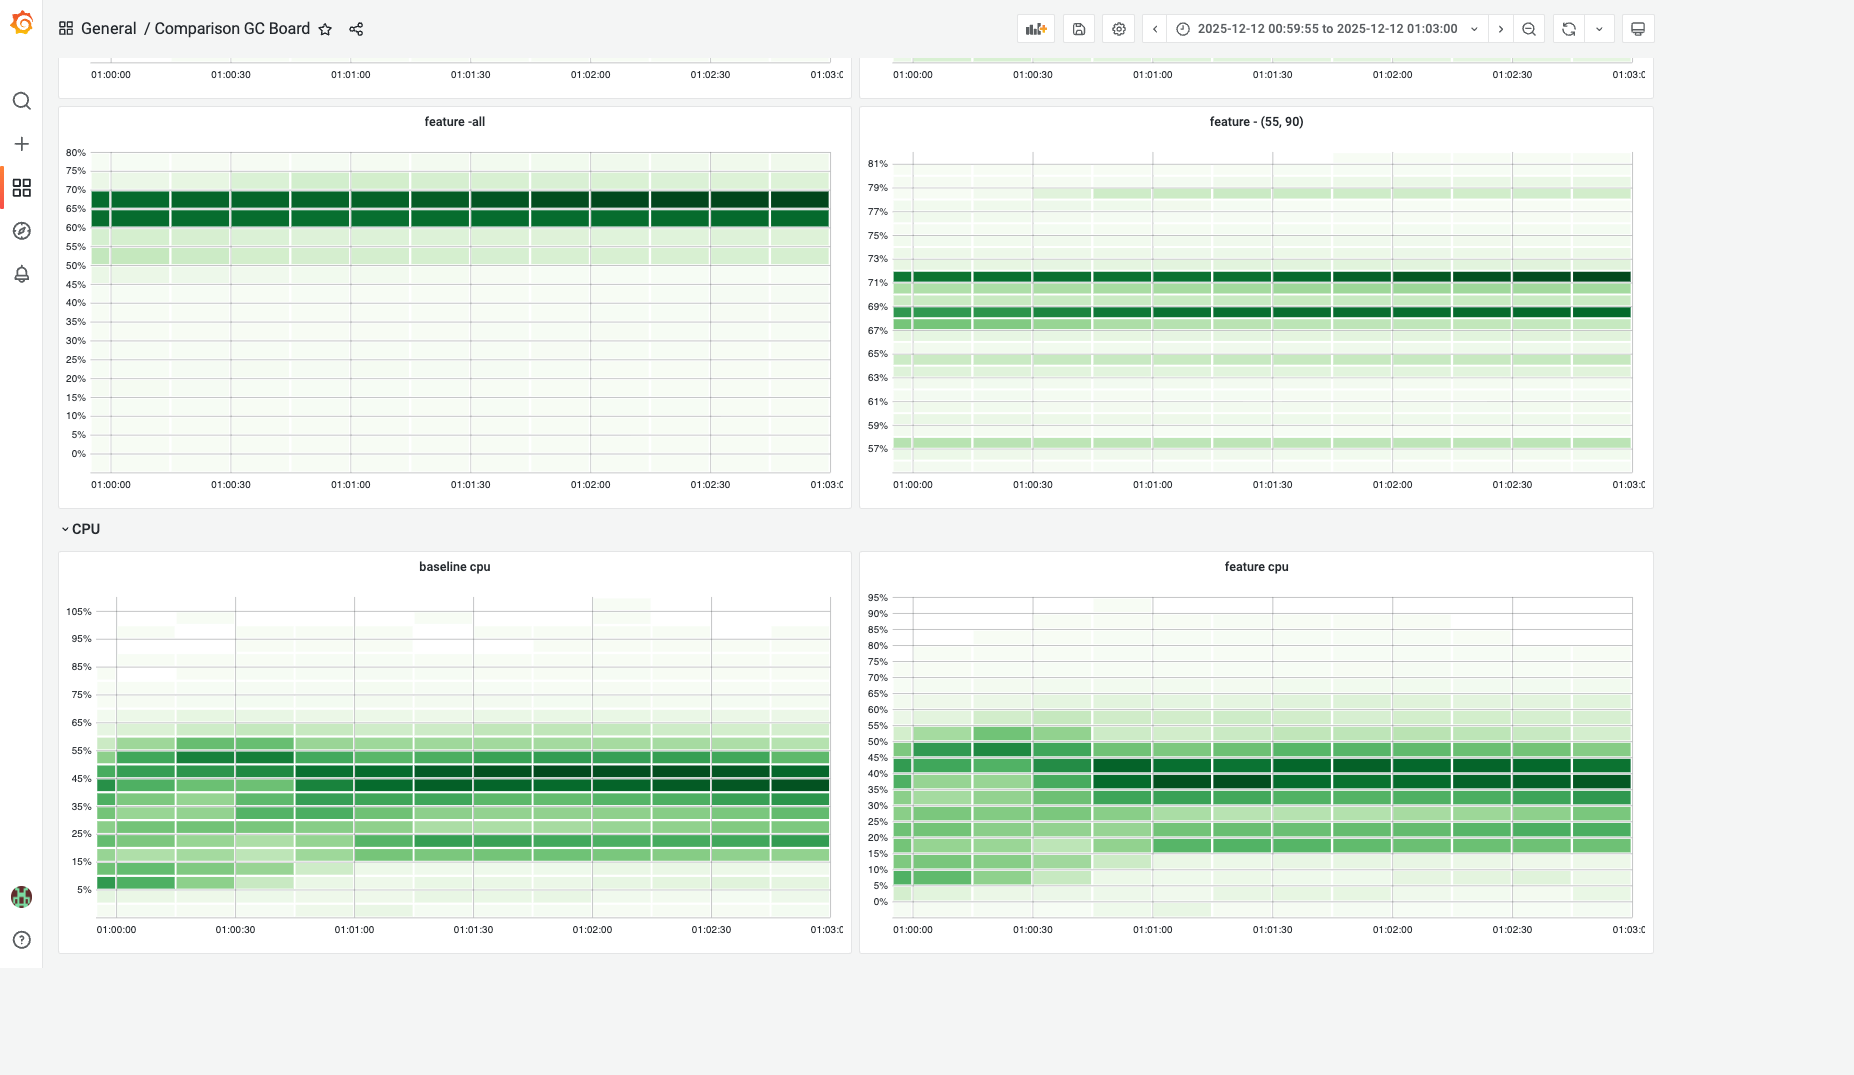
The CPU usage heatmap shows the featured cpu usage has overally distributed at 35-45%, while 40-45% cpu usage in baseline. Roughly 5% cpu usage improvement.
*Note: the timespan is quite short(3min only) because I have joined the whole 116k instances by 2 separated metrics(memory/cpu usage and the runtime toggle) to offer a better distribution graph.
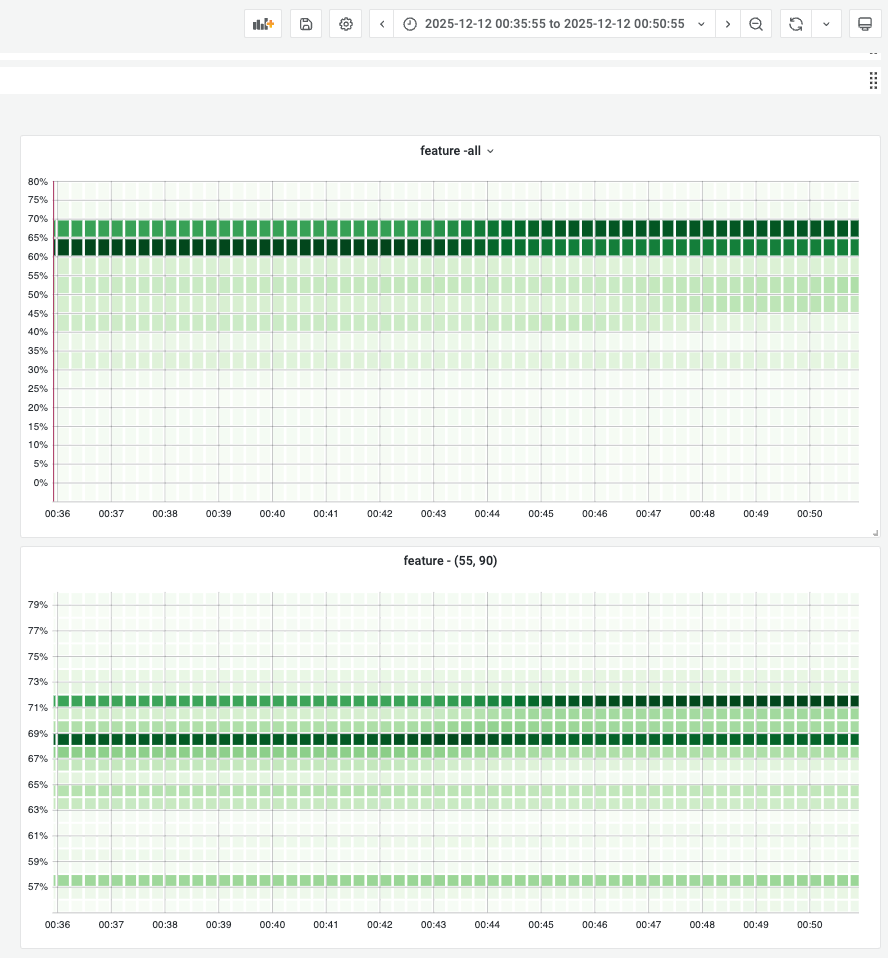
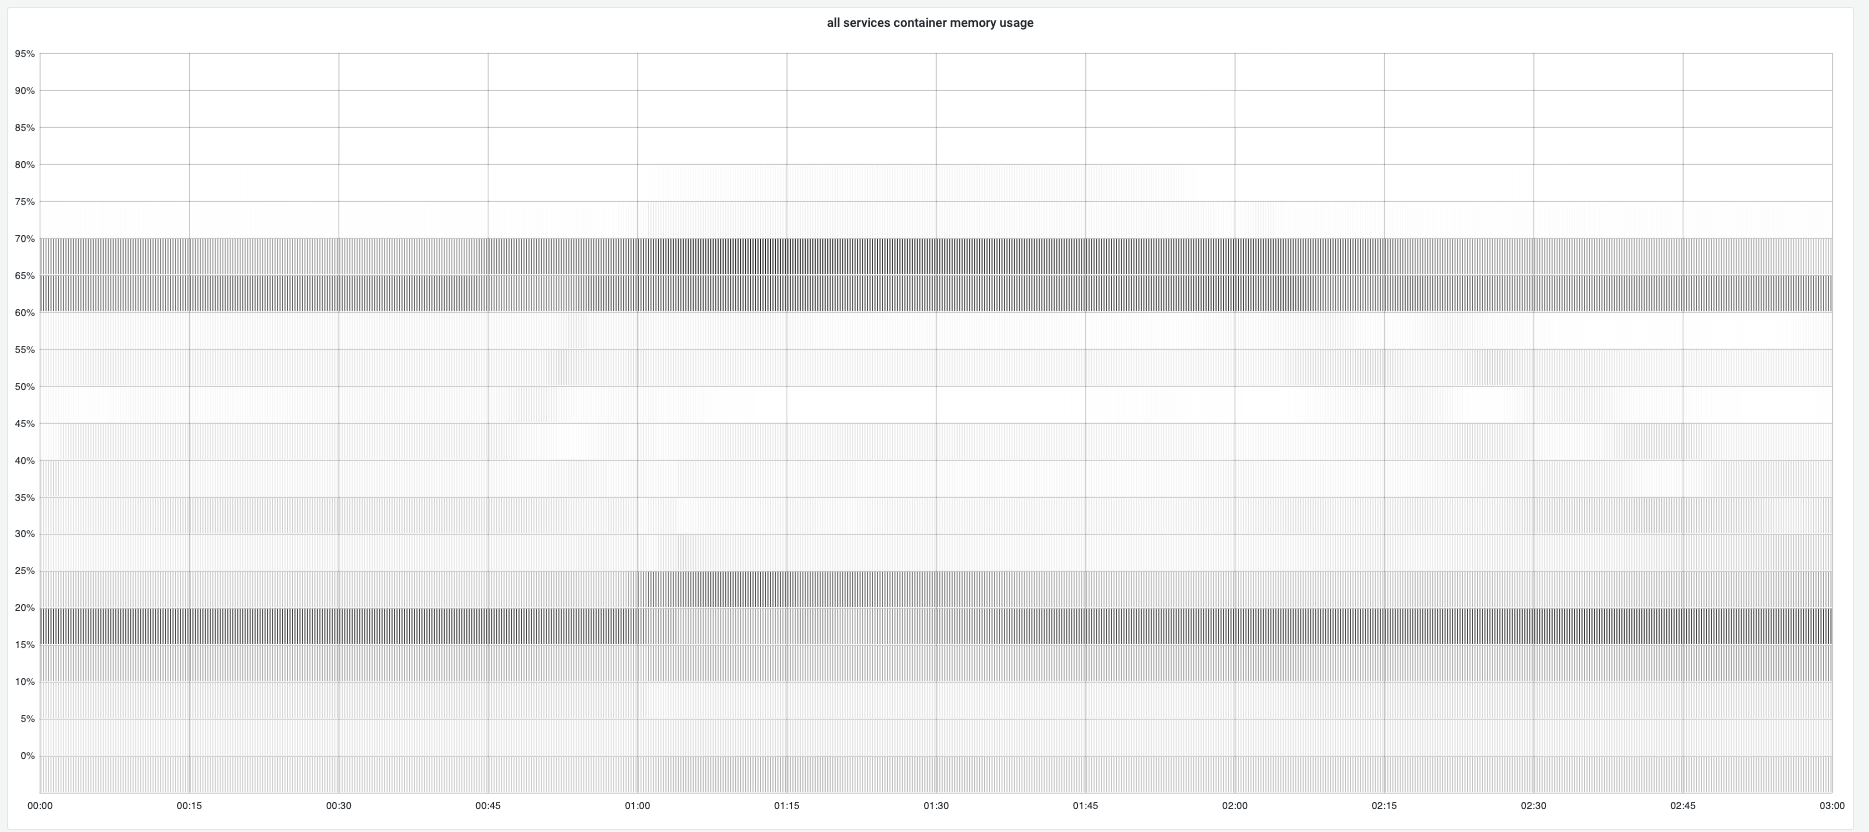
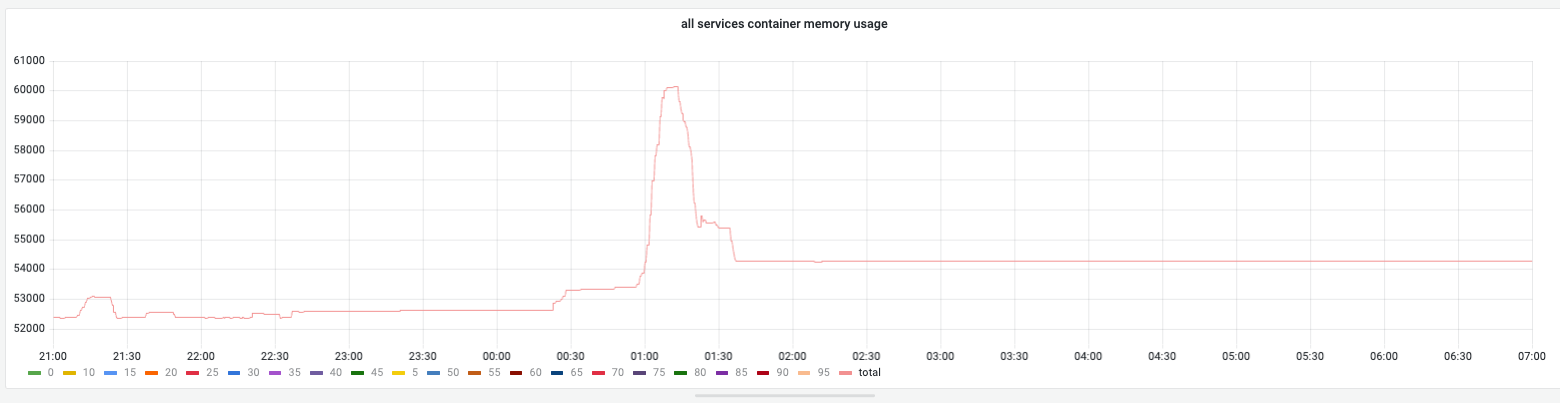
GC Tuned Memory During Campaign
During campaign, gc tuner will set 70% memory usage as target heap so gc will try to keep memory usage under 70% and the total container memory usage stays near 70%.
Below shows the concrete memory usage distribution for all gc tuner enabled instances to demonstrate the golang runtime gc has well ablility to keep memory usage at a reasonable position.
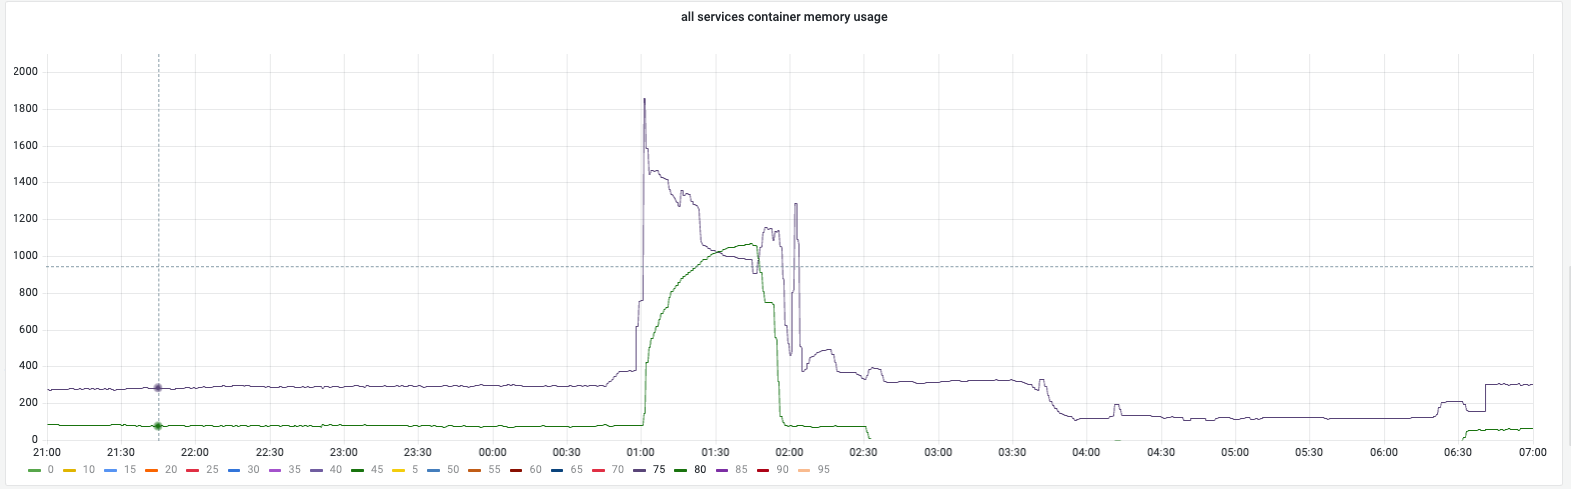
Before campaign:
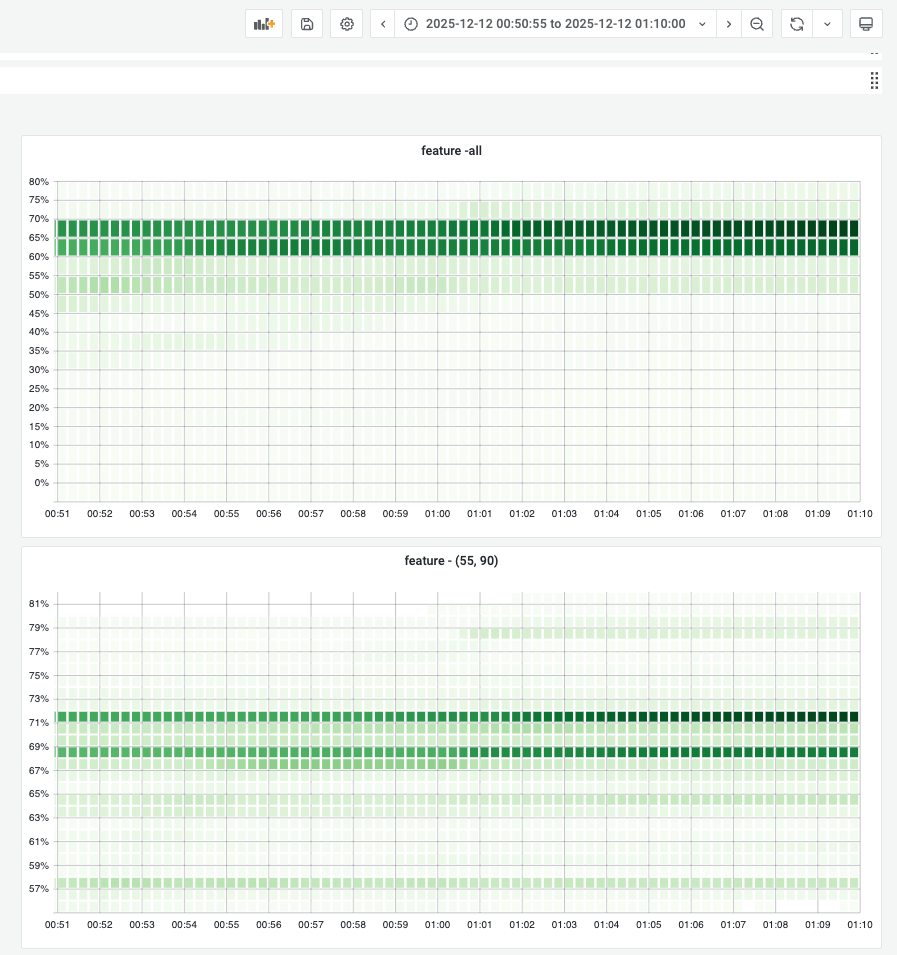
During campaign: Memory locked at preset boundaries. Stability was high.
After campaign:
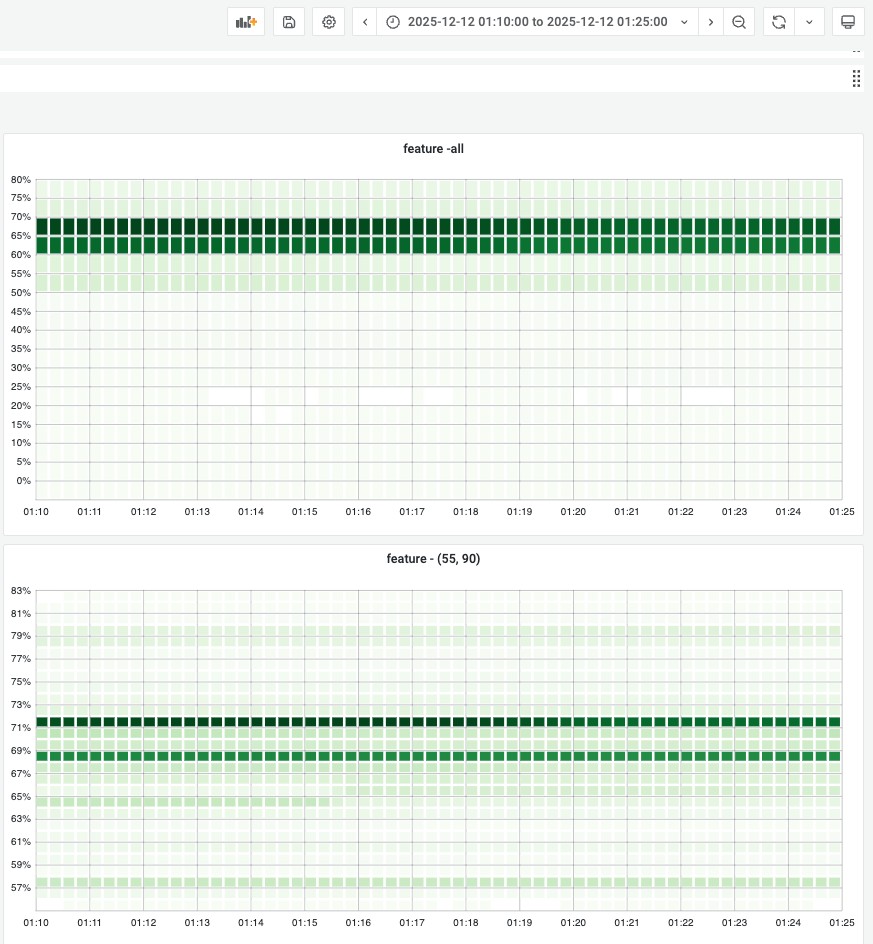
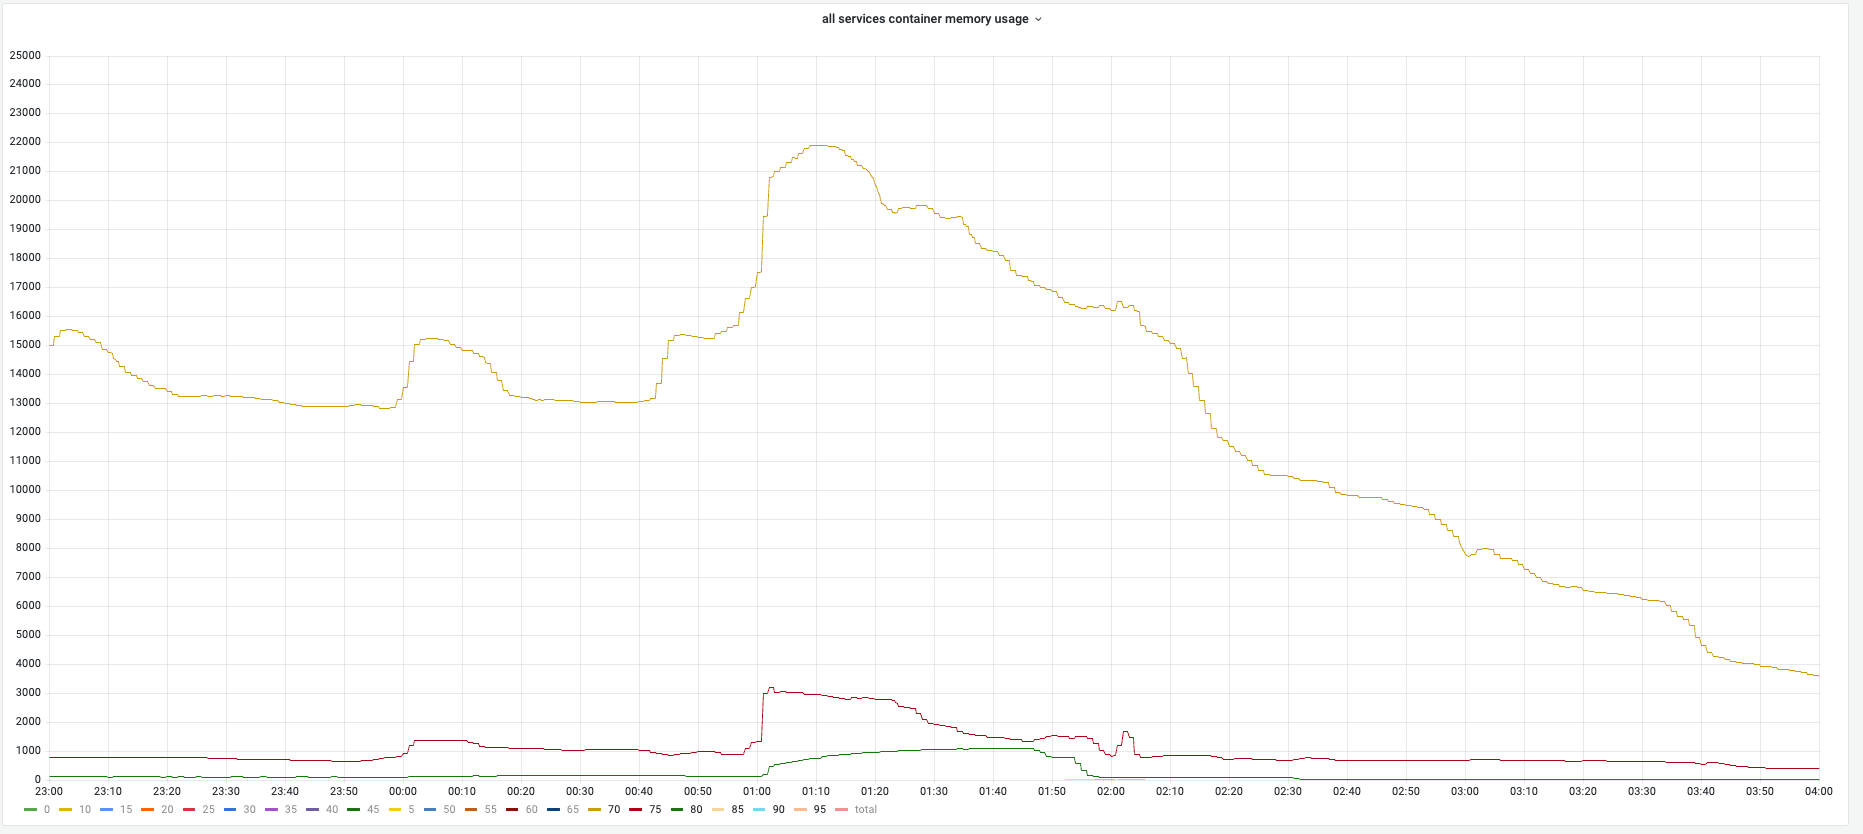
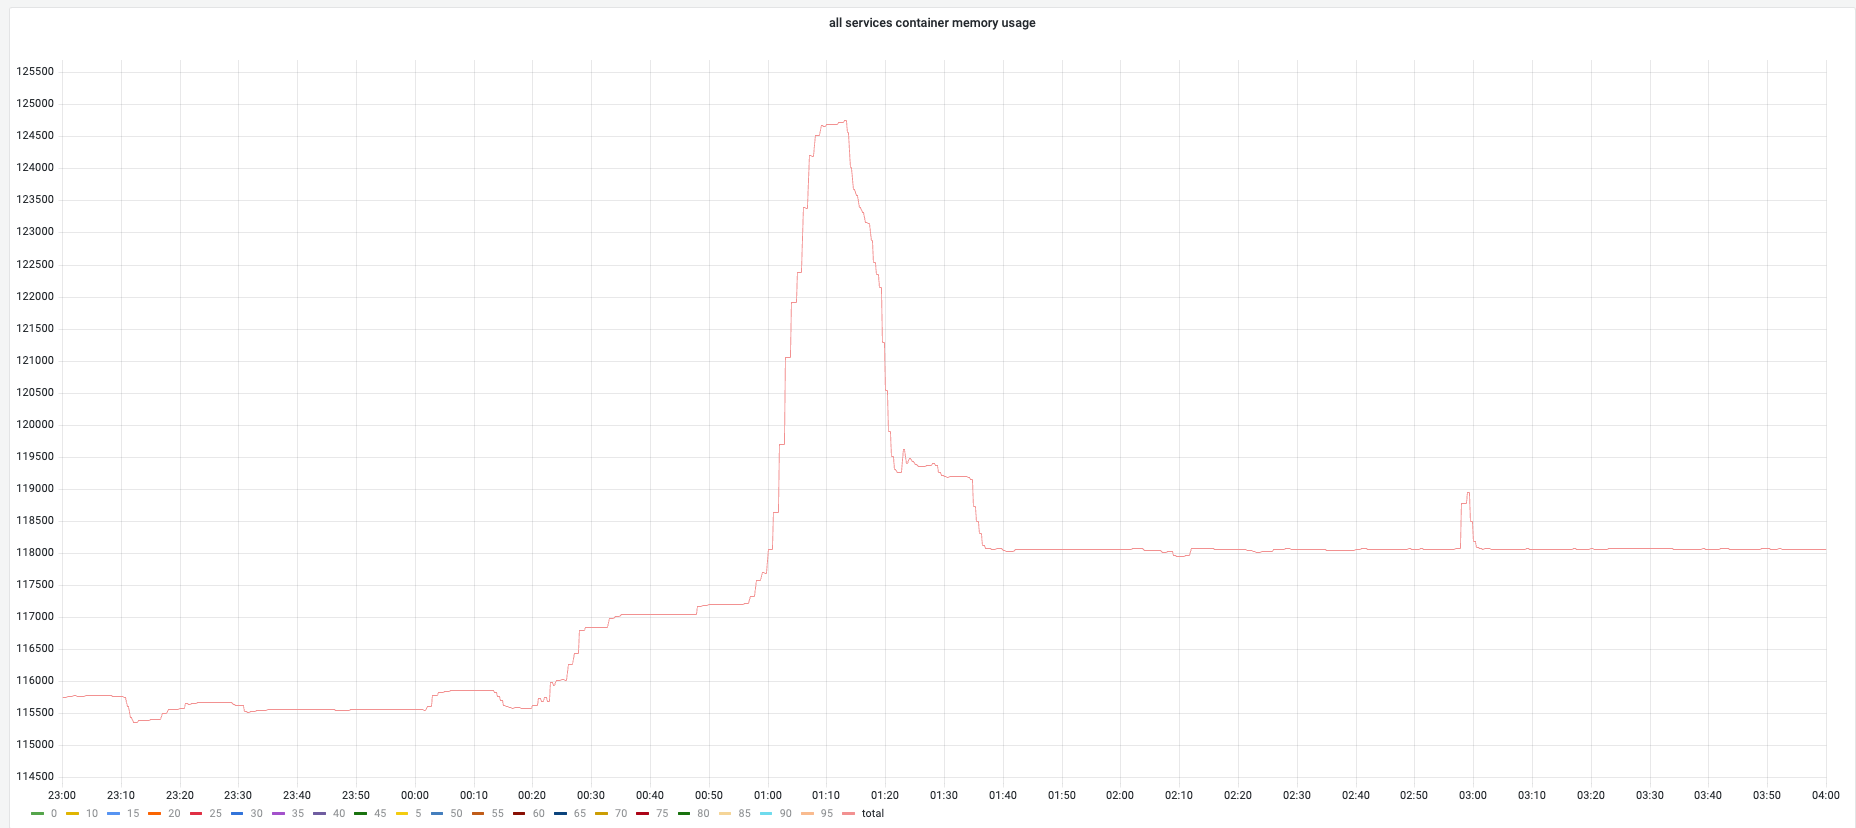
Overall memory trend:
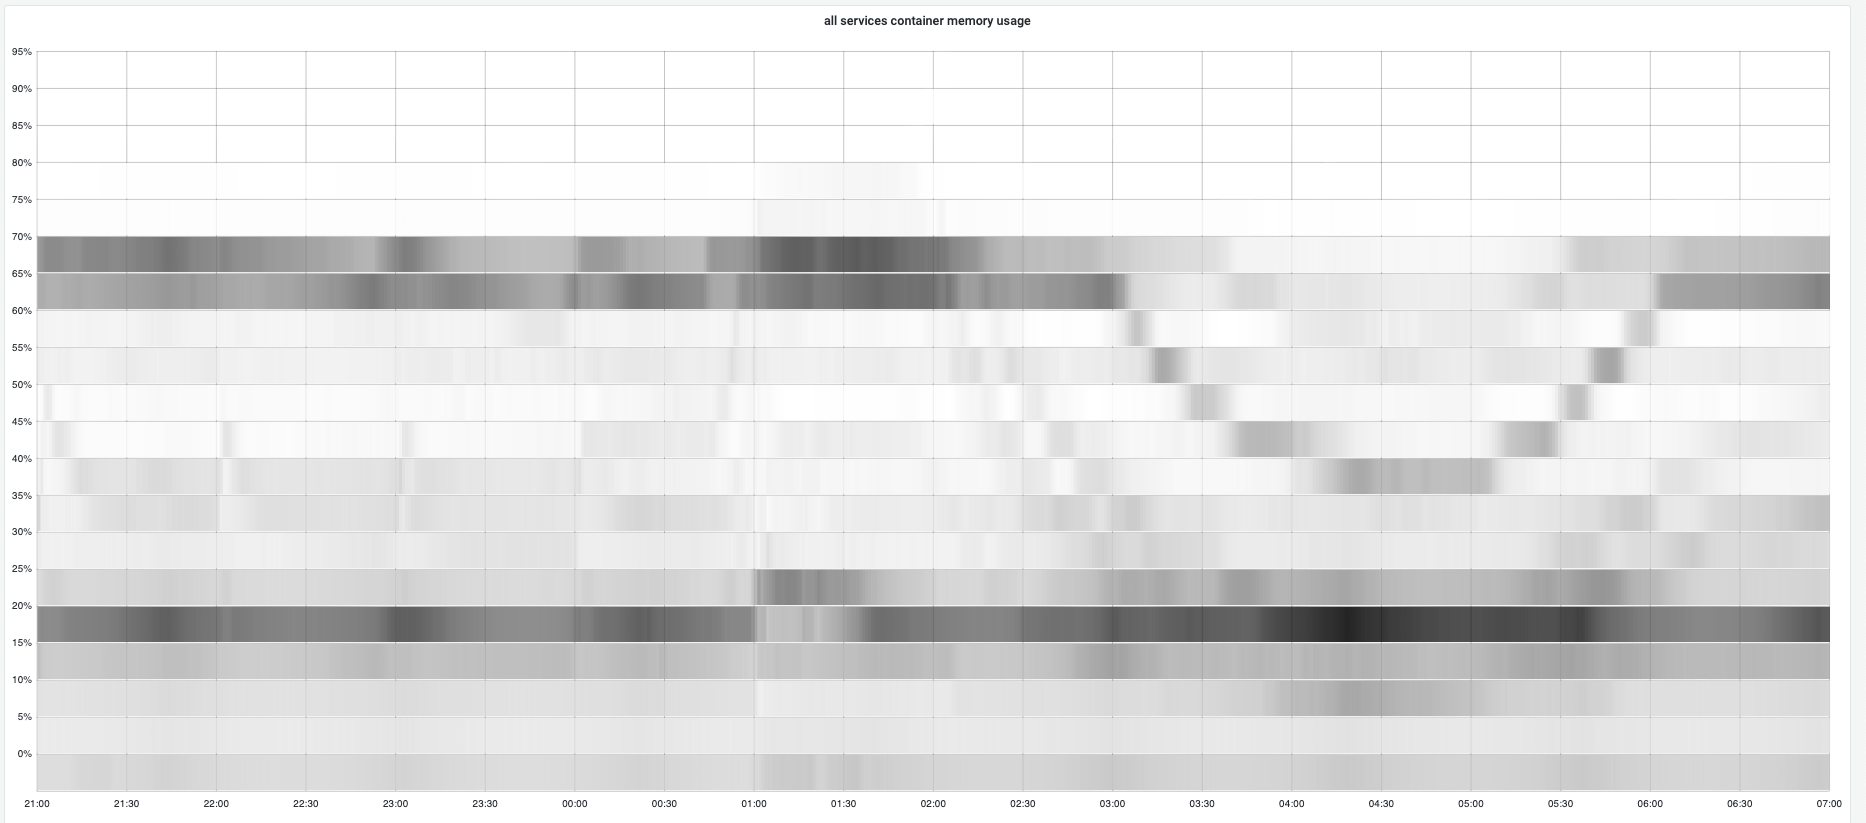
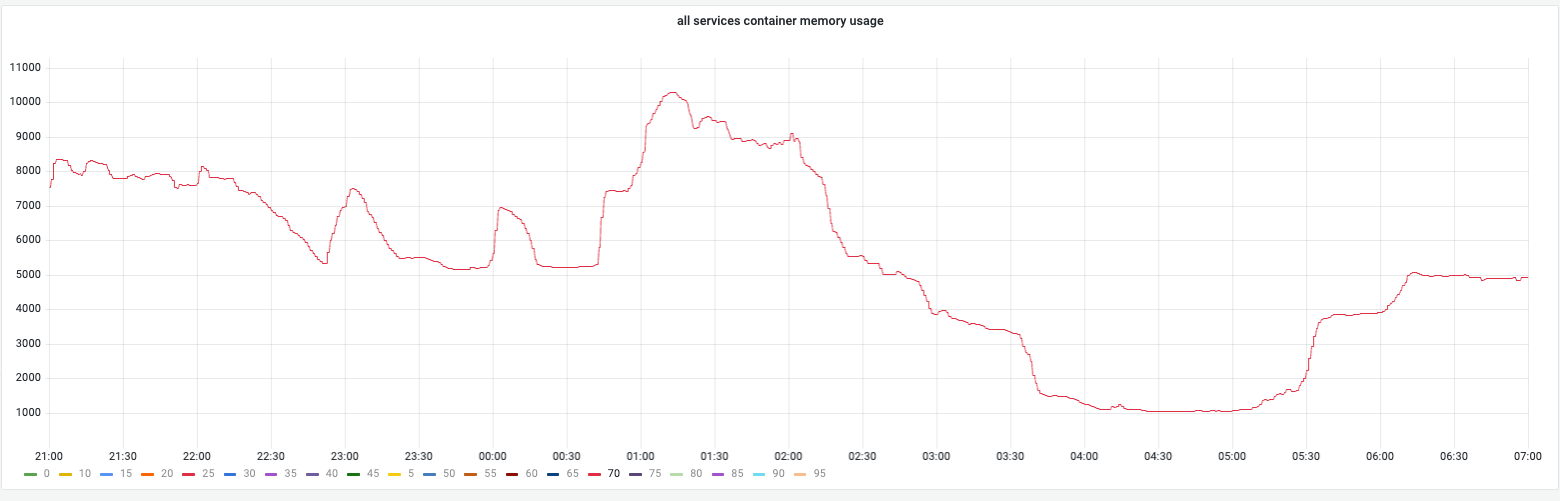
Overall memory changes:
3. STW and App Latency
Campaign execution: - Zero incidents: No OOM, no latency-related failures - Zero alert fatigue: Alert thresholds proactively adjusted following our SOP - Smooth execution: Campaign completed without any alerts
4. Service Selection
Selection criteria: - Large CPU quota and sufficient memory - Ignore services with 70%+ memory usage (not suitable for GC tuner) - Select top 100 services by CPU quota
Rationale: By selecting services meeting these criteria, we balanced maximizing CPU coverage with manageable rollout workload.
Top Services (Anonymized)
| Service Type | Memory | CPU Cores | Instance Count |
|---|---|---|---|
| Pricing Service A | 99.1 TiB | 50.7 K | 6.36 K |
| Promotion Service B | 96.8 TiB | 49.5 K | 6.22 K |
| Price Boundary C | 93.2 TiB | 47.7 K | 5.97 K |
| Listing Aggregation D | 74.4 TiB | 39.1 K | 4.91 K |
| Usage API E | 71.6 TiB | 36.5 K | 9.18 K |
5. GC Tuner Design
Mechanism
The GC tuner uses a runtime toggle to enable GC tuning for specific instance percentages. It checks current live heap and memory usage to determine whether to adjust GOGC. A dedicated gc_tuner_status metric indicates the current state.
Safety
- Additional container-level RSS exposed (cluster IP is container-level, business metrics are instance-level)
- Go runtime metrics validate
GOGCandtarget_heapmatch expectations - GC tuner is adaptive—all safety protections except manual config changes are automatic
6. Data Collection
Metrics Collected
- Container CPU usage (cgroup metrics)
- Memory RSS (container level)
- Go runtime metrics (
go_memstats_*) - API latency: P50 / P95 / P99
- Application error rate
- OOM / restart count
Latency Analysis Method
Query: Pull 10-minute window of p50/p95/p99 time series
Window processing: Extract "window features" for each service, metric (API latency, STW), and percentile (50/95/99)
Metrics: - Main representative: median(x(t)) - Bad level (p95-of-time): quantile(x(t), 0.95) — worst 5% of time in 10min window - Stability/jitter: hi / repr — identifies "p99 tail jitter"
Comparison: - Absolute change: Δ = after_repr - before_repr - Relative change: r = (after_repr - before_repr) / before_repr - Degradation condition: (r > r0) AND (Δ > Δ0)
Thresholds: - p50: r0=3%, Δ0=0.2ms - p95: r0=5%, Δ0=1ms - p99: r0=8-10%, Δ0=2ms
7. Production Observations
Throughout this project, we documented several production-only findings—behaviors that can only be discovered by running systems at scale:
| Observation | Key Finding | Link |
|---|---|---|
| RSS vs Heap Target | RSS (79.5%) exceeds heap target (70%) due to scavenger buffer + non-heap overhead | → |
| Latency Tail Analysis | Window feature extraction method for detecting P99 jitter | → |
| Memory Lock Behavior | Memory usage "locks" at preset bounds during steady state | → |
| Scavenger Elasticity | Memory scales with load and returns to OS after traffic decreases | → |
| Assist Ratio Spikes | Transient spikes during traffic surges, not sustained elevation | → |
| STW Paradox | Individual pauses ↑10-20%, but total STW time decreased | → |
Further Reading
Theory Articles
- GC Pacer Theory
- GC Sweep Theory
- GC Mark Theory
- Allocation and GC
- Scavenging Theory
- Go Runtime Metrics